There is knitter’s graph paper which can be downloaded at the gauge you need. The boxes are closer to the dimensions of knit sts than regular graph paper.
That way you can play around with the rate of decreases for the raglan shaping and correlate it to measurements.
Here’s one of the sites.
https://www.sweaterscapes.com/land-chart-paper.htm
Oh I think I might be confused about the entire concept.
Here I tried to map out the slope of the left front and left sleeve.
The increase row has you knit two stitches, M1L, knit to the marker, M1R, slip M, knit 1 stitch, slip M M1L.
The red retangles are stitch markers.
The rightmost black line is the left neckline, the middle band leftmost lines are…the raglan line? Or maybe the just the leftmost is the raglan line?
I’m think I’m having trouble understanding how the increases affect each other. I can do the slope for one line (M1R every four rows for example)- but having other increases will of course affect the slope and I’m having trouble mapping it out. Here I tried to remember that the other increases will increase the stitch count, so the beginning of row will be further out.
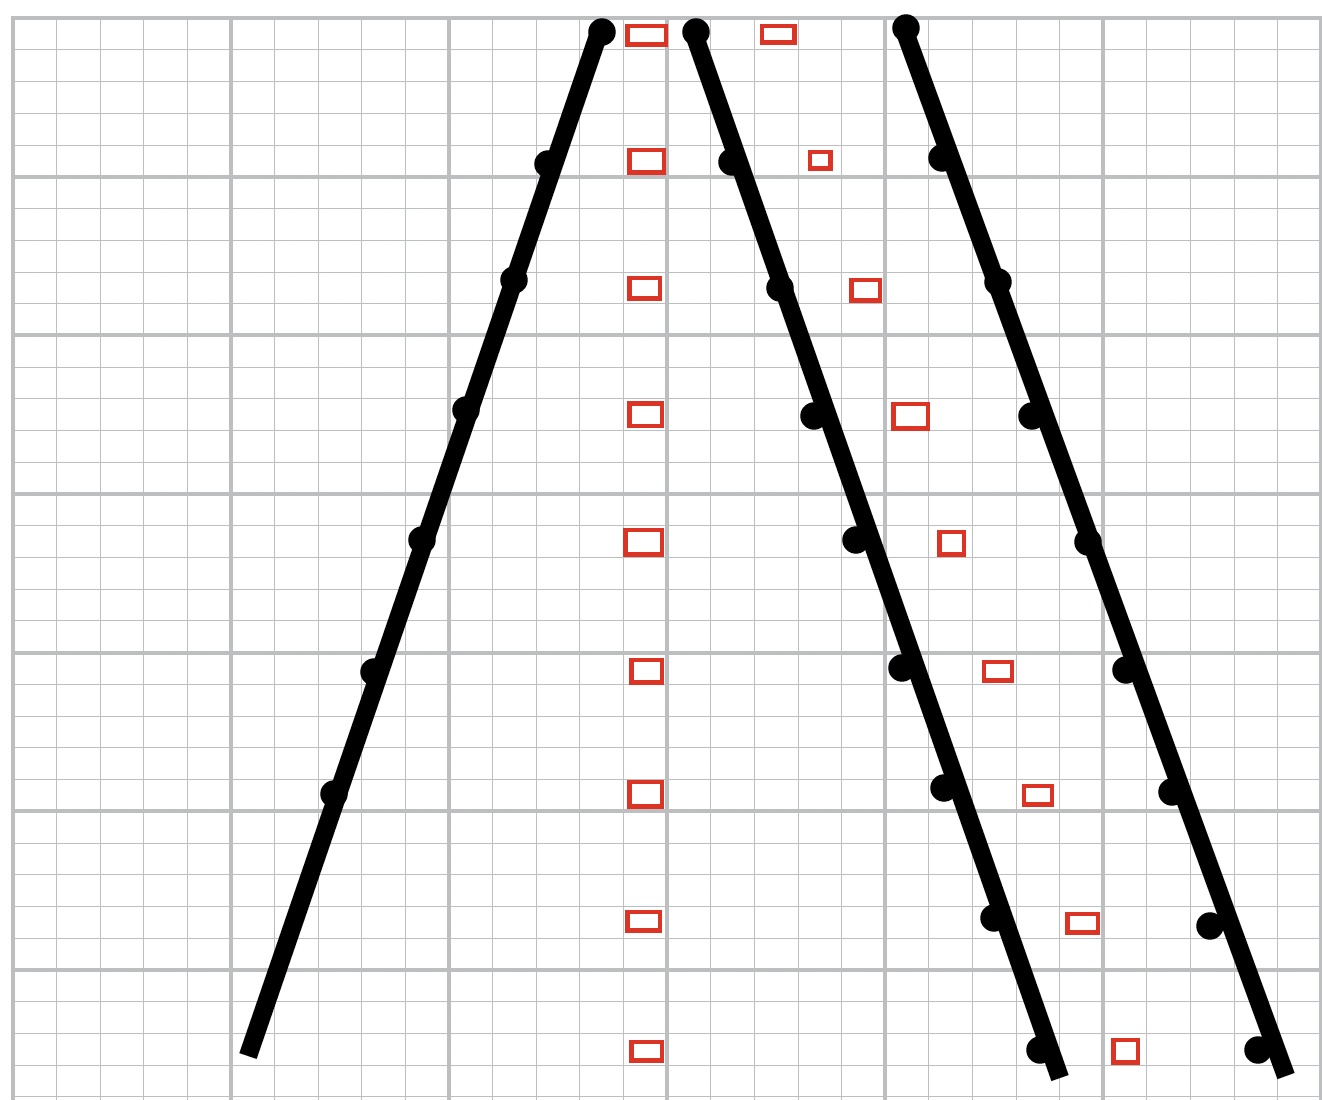
But I don’t think I was correct with any piece of this because I’m not seeing the triangle that I should be seeing…unless I ignore the middle black line?
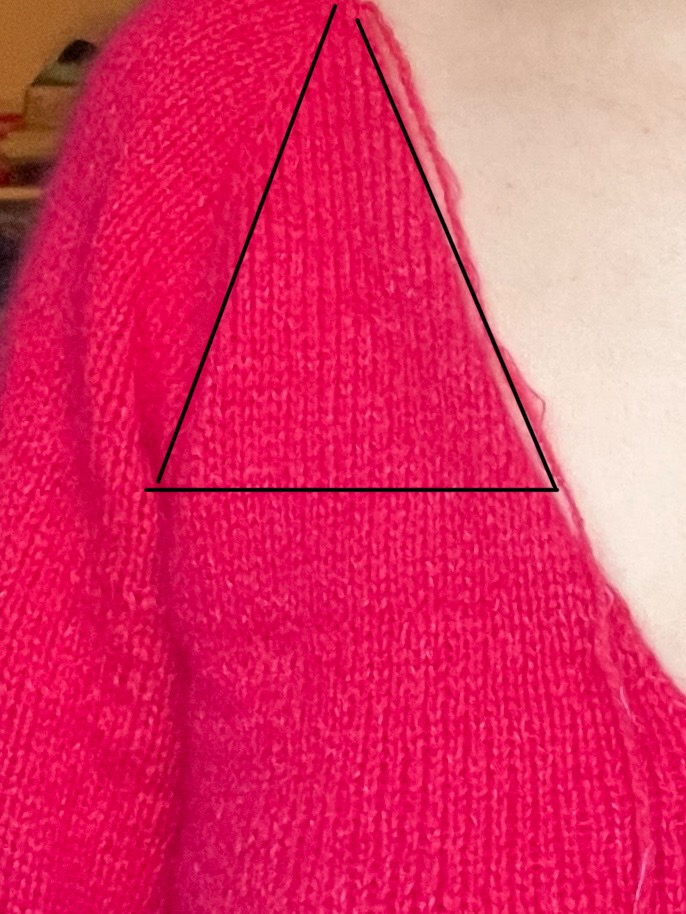
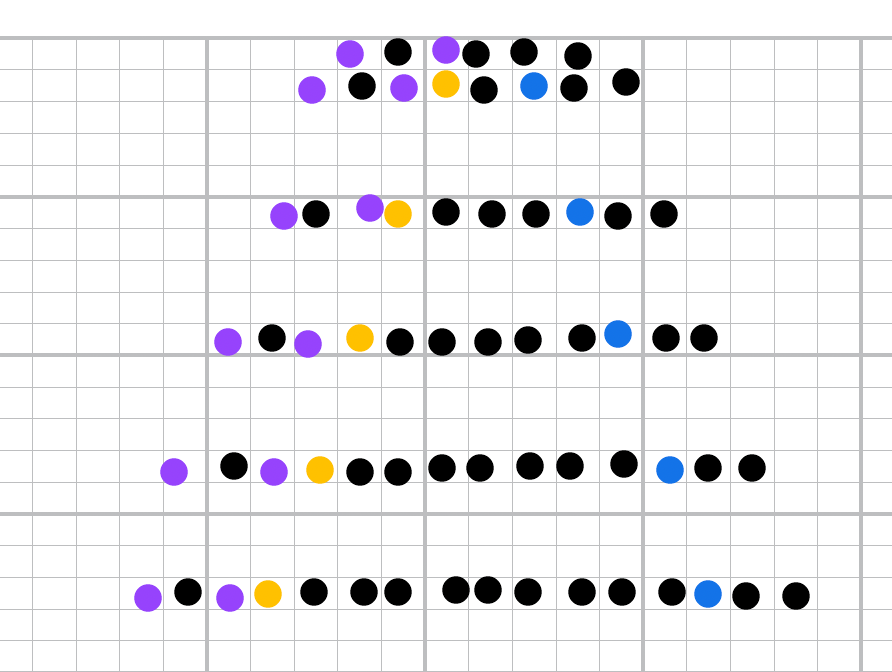
Actually I think I might be getting it now. The blue square is a M1L and the yellow square is a M1R. I’m starting to see the triangle
If I understand the row, it seems that you have an extra M1L. The design would be:
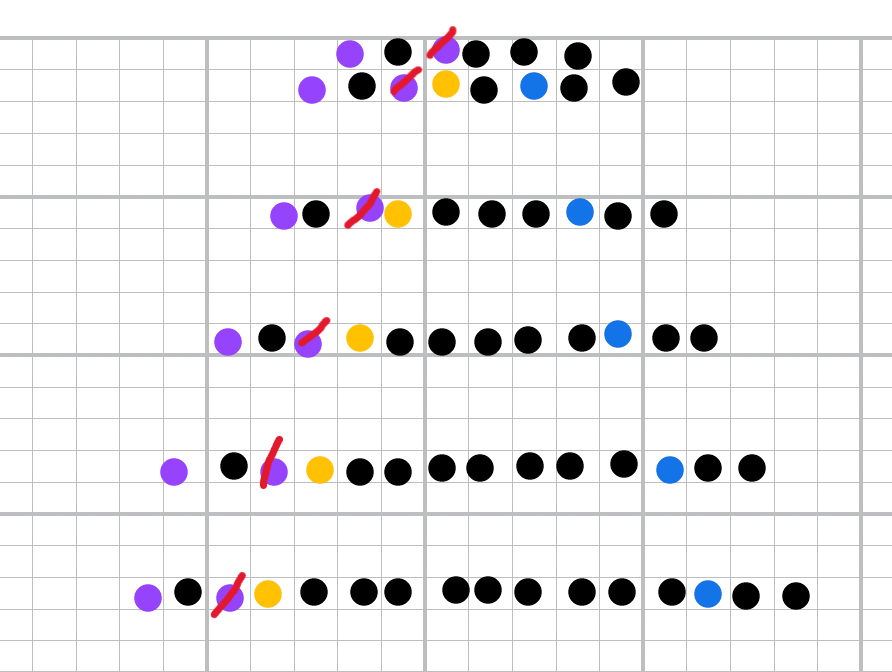
with the extra M1 crossed out in red
Oh the purple is the stitch marker actually!
Ah, ok, thank you. Then the two purples are the stitch markers either side of the raglan stitch. Looks good then as you have it with another blue M1L to the left of the leftmost purple stitch marker.
“…knit two stitches, M1L, knit to the marker, M1R, slip M, knit 1 stitch, slip M M1L.”